An integrated approach to offshore wind energy assessment (AIATOWEA): Experiment 1: Wind farm in northern Indiana. |
|
Overview
Objectives
Understanding how wind turbines interact with the atmosphere and how the wakes generated by wind turbines recover in the atmosphere are critical areas of fluid dynamics within wind engineering. Improved quantification of these effects using the latest generation of remote sensing and other instrumentation (including UAV) were a major motivator of this project and this experiment. The 3D wind and turbulence characteristics of the atmospheric boundary layer experiment (3D Wind) was conducted to evaluate innovative remote sensing and in situ platforms for measurements of wind and turbulence regimes. The experiment is part of a planned series that focuses on quantifying wind and turbulence characteristics at the scales of modern wind turbines and wind farms and was conducted in northern Indiana in May 2012. 3D Wind had the following specific objectives: (i) intercomparison experiments evaluating wind speed profiles across the wind turbine rotor plane from traditional cup anemometers and wind vanes on a meteorological mast and from a tethered balloon, sonic anemometers (mast mounted and on an unmanned aerial vehicle), three vertical-pointing (continuous wave) lidars and a pulsed scanning lidar, and (ii) integrate these measurements and output from 3-km-resolution (over the inner domain) simulations with the Weather Research and Forecasting Model to develop a detailed depiction of the atmospheric flow, upwind, within, and downwind of a large, irregularly spaced wind farm.
Major results
Data closure: The 3D Wind experiment was designed to evaluate innovative remote sensing and in situ platforms for measurements of wind and turbulence regimes in the lowest 200 m of the ABL. Results from this experiment show that both types of lidars exhibit very close agreement with collocated cup anemometers at heights extending across the rotor plane of the current generation wind turbines (i.e., Pearson correlation coefficient r ≥ 0.89 and a high degree of linearity in response to varying wind speed). Data from cup anemometers deployed on a tethered balloon also exhibited r ≥ 0.8 with the closest lidars and MM-mounted cup anemometers. Thus, while there remain some discrepancies between wind speed datasets from these instruments, the degree of accord is sufficient to remain cautiously optimistic (see Barthelmie et al. 2014).
Model evaluation: Datasets deriving from experiments such as the one described herein offer a range of opportunities for exploring fundamental questions pertaining to wind regimes within 200 m of the surface. For example, the degree of agreement between wind speeds as simulated by WRF in a 3 km × 3 km grid cell containing the primary measurement site indicates that for these simulations (using the Mellor–Yamada–Janjic PBL scheme and the USGS land cover classification), the destabilization of the nocturnal stable layer was delayed in WRF relative to the observations, leading to decreased correlation. Further, wind speeds at 80 m as simulated with WRF were, on average, lower than the measurements. This finding is consistent with results from previous applications to the marine PBL (Suselj and Sood 2010) but is in contrast to comparison conducted relative to wind profilers in Japan, which found a positive bias throughout the lowest 1000 m for all PBL schemes tested within WRF (Shimada et al. 2011) (see Barthelmie et al. 2014).
Whole wind farm wakes: Observations of wakes using the lidars (vertically pointing and scanning) and from mast-deployed anemometers indicate that directly downstream of a turbine (at a distance of 190 m, or 2.4 rotor diameters (D)), there is a clear impact on wind speed and turbulence intensity (TI) throughout the rotor swept area. However, at a downwind distance of 2.1 km (26 D downstream of the closest wind turbine) the wake of the whole wind farm is not evident. There is no significant reduction of hub-height wind speed or increase in TI especially during daytime. Thus, in high turbulence regimes even very large wind installations may have only a modest impact on downstream flow fields. No impact is observable in daytime vertical potential temperature gradients at downwind distances of >2 km, but at night the presence of the wind farm does significantly decrease the vertical gradients of potential temperature (though the profile remains stably stratified), largely by increasing the temperature at 2 m. Our results thus imply that at land-based wind farms wake recovery is very rapid (see Smith et al. 2013).
Journal Publications
Videos and Photographs
Videos
Here is a site featruing photos and videos of the northern Indiana field experiment: Videos and more!Photographs
Here are some photographs of the instruments we deployed during this experiment: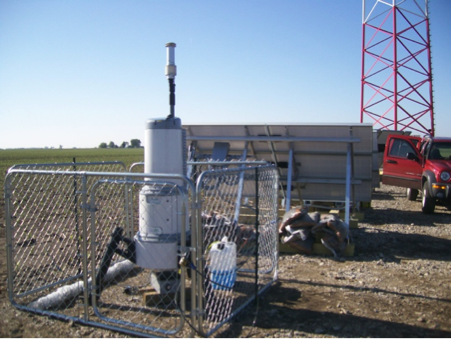 ZephIR profiling lidar near one of the meteorological masts on the edge of the wind farm
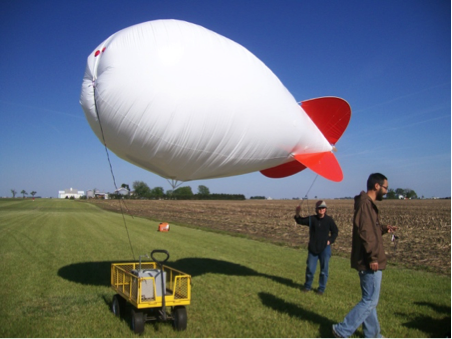 Tethered lifting device (Tethersonde) that we used to make profiles of the atmosphere using 2 instrument packages
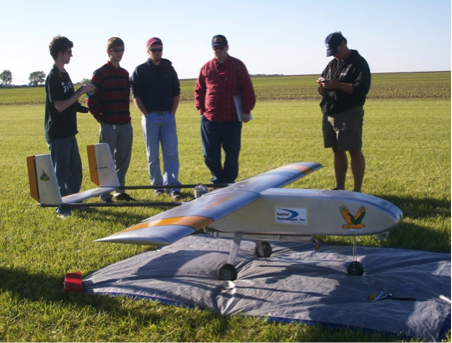 The Clarkson UAV ready for take-off!
Data
The dataset for this experiment is complex and too large to be hosted on a Cornell faculty members website due to space limitations. However, we will be happy to provide data on request. Please note the following caveats: Naturally we can not disclose data collected by other investigators. For data from the ZephIR lidar owned by Case Western - please contact David Matthiesen (email: david.matthiesen@case.edu). For data from the UAV - please contact Pier Marzocca (email:pier.marzocca@rmit.edu.au). Unfortunately when the investigators left IU they were told all model output (from our WRF simulations had to be deleted from our backups - so sadly we can not distribute those - but the WRF set-up is fully documented in Barthelmie et al. 2014. Lastly, data from the wind turbines operating in the wind farm can not be disclosed due to NDA.