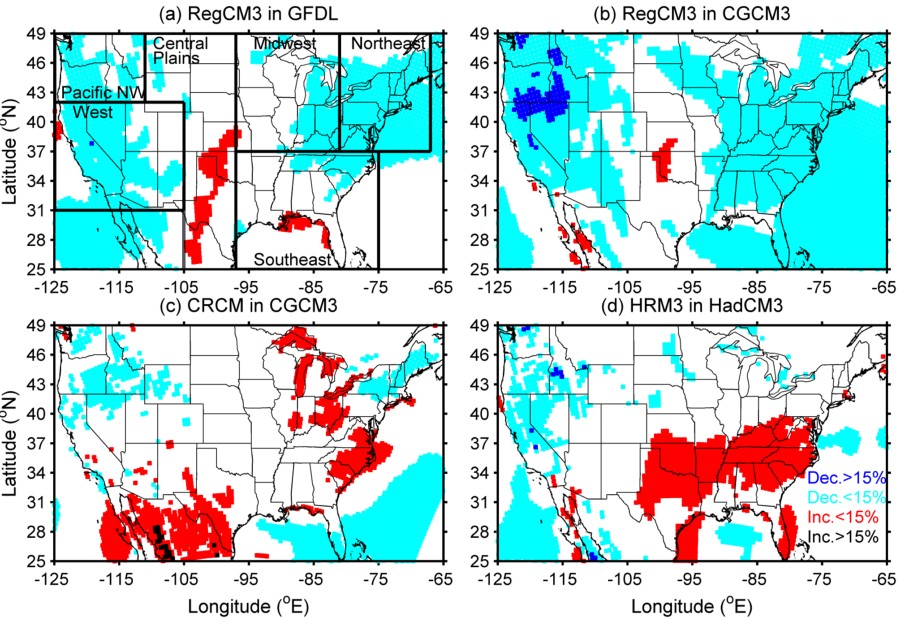
Figure 3. Difference in the mean wind energy density (in %) for 2041–2062 vs. 1979–2000
A–D show the different AOGCM–RCM combinations. The sign and magnitude of change is only shown for grid cells where the value for the future period beyond the 95% confidence intervals on the mean value during 1979– 2000. The colors depict both the sign and magnitude of the difference using the legend in D.| Latitude (N) | Longitude (E) | Difference in Mean Energy Density (%) |
| - | - | - |
|