Move your cursor over the station of interest to find the trends in each of the aforementioned metrics.
Analysis of precipitation climates: Historical and future climate regimes
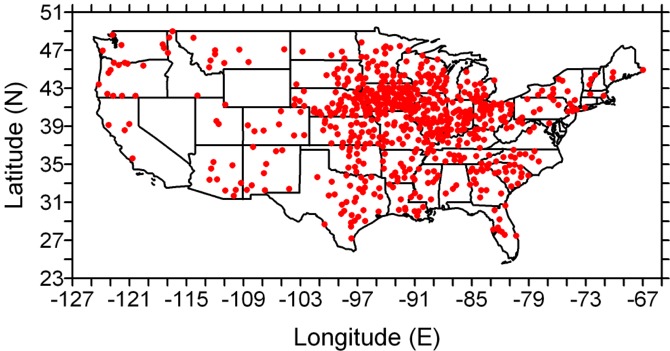
Stations depicted that have at least 80 years of data between 1895 and 2002 during which > 360 days of valid data per year are available.
The trend analysis conducted is based on Kendall’s tau and uses a 90% confidence interval.
The metrics depicted are:
|
|
Total precipitation |
90th percentile |
Sum of precipitation on the top-10 wettest days |
95th percentile |
Fraction of precipitation from events in excess of p90 |
Wettest pentad |
Daily intensity |
Number of rain days |
|
Abbreviation used herein |
Total |
p90 |
big10 |
p95 |
fap90 |
wp |
di |
nr |
The units of the trends are %/decade
| Latitude (N) | Longitude (E) | Total | p90 | big10 | p95 | fap90 | wp | di | nr |
| data | data | data | data | data | data | data | data | data | data |
|
Move your cursor over the station of interest to find the trends in each of the aforementioned metrics. |