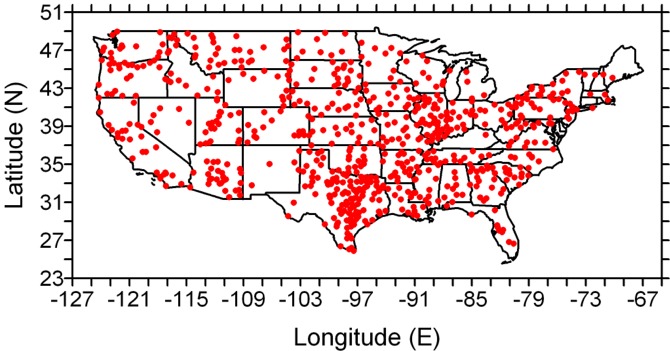
Move your cursor over the station of interest to find the trends in each of the aforementioned metrics.
A value of zero in the difference column indicates the difference was not significant at the 90% confidence level.
precipitation seasonality
This page depicts analyses of the day-of-year on which given percentiles of the total precipitation are achieved.
Data are presented on the mean year day on which the 10th, 25th, 50th, 75th and 90th percentiles of the annual total precipitation were achieved during 1971-2000, and also the difference between 1971-2000 v. 1941-1970.
| 1971-2000 | Difference 1971-2000 v 1941-1970 | |
| 10th percentile | data | data |
| 25th percentile | data | data |
| 50th percentile | data | data |
| 75th percentile | data | data |
| 90th percentile | data | data |
|
Move your cursor over the station of interest to find the trends in each of the aforementioned metrics. A value of zero in the difference column indicates the difference was not significant at the 90% confidence level. |